
Figure 2.
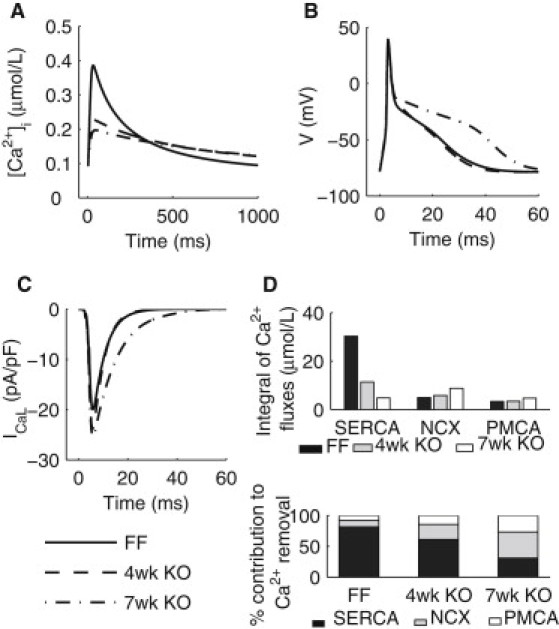
Simulation results from the FF, KO four-week, and KO seven-week models during an cardiac cycle at 1 Hz. (A) [Ca2+]i transients paced. (B) (Top panel) APs. (Bottom panel) Timecourses if ICaL during an AP. (C) Ca2+ fluxes through SERCA, NCX, and PMCA. (D) (Top panel) Integrals of Ca2+ fluxes through SERCA, NCX, and PMCA. (Bottom panel) Percentage contributions of SERCA, NCX, and PMCA to Ca2+ removal.