
Figure 3.
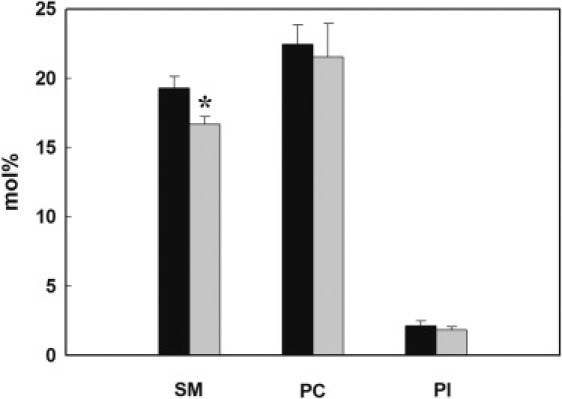
Mass spectrometry analysis of different lipids in RBCs. Erythrocytes were incubated in hypotonic buffer at 37°C for 0 min (dark bars) and 6 min (gray bars). After lipid extraction, amounts of SM, PC, and PI were analyzed by mass spectrometry as described in Materials and Methods. ∗Significant difference from time 0 min (p < 0.05).