
Figure 1.
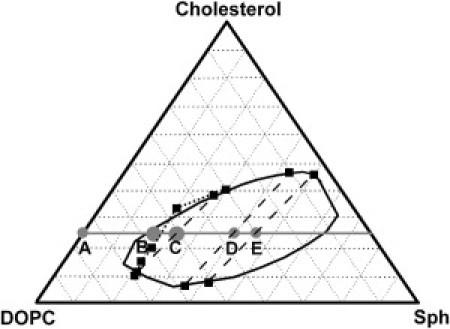
Ternary phase diagram for DOPC/Sph/Cholesterol lipid mixtures given in the literature: solid curve, tie-lines, and the dotted curve were published by Smith et al. (16) and Farkas et al. (17), respectively. The line connecting points A to E denotes constant cholesterol content. All measurements were done in marked points A to E corresponding to the lipid compositions given in Table 1.