
Figure 2.
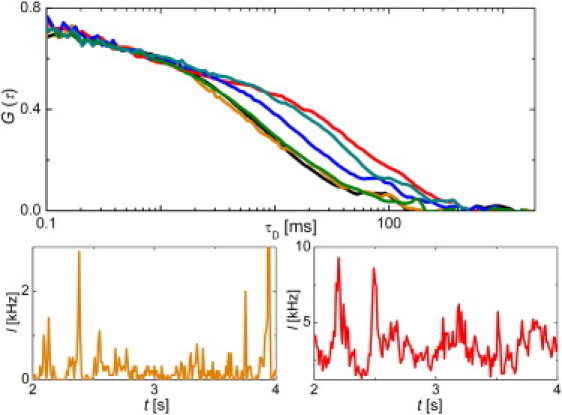
Upper part: autocorrelation curves for CTxB-647 in upper GUV membrane centered in the waist of the focal spot at different lipid compositions: A (black), B – low load of CTxB-647 (orange), B – high load of CTxB-647 (red), C (blue), D (olive), E (dark cyan). Lower part: intensity traces for CTxB-647 in B composed membranes at low (orange) and high (red) load of CTxB-647.