
Figure 4.
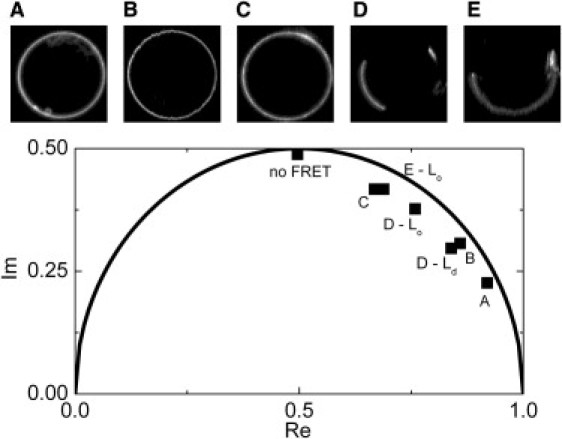
FLIM-FRET phasor diagram depicting peak positions of the two-dimensional histogram of transformed donor fluorescence decay functions measured at every pixel of the GUV image. Upper part: fluorescence intensity images of CTxB-488 (donor) stained GUVs at different lipid compositions. GUVs are colabeled with DiD (acceptor). For D, two clusters appeared in the phasor diagram, corresponding to the Lo and Ld phase. The circular line depicts positions of monoexponential decays and position of the acceptor free decay, i.e., no FRET, is marked.