
Figure 6.
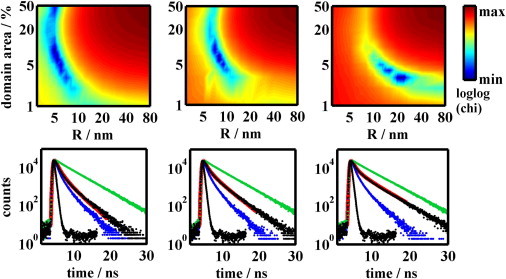
Upper part: Best fitting χ2-square parameter as a function of the domain radius and the area domains take up in the bilayer. A minimum is found at R = 5 nm and domain area 9% for composition B (on the left), R = 8 nm and domain area 6% for composition B′ (in the middle), and at R = 24 nm and domain area 3% for the composition C (on the right). Lower part: Displayed time resolved fluorescence decays of CTxB-488 serving as the donor (D) representing the bilayer containing i), D only (green line); ii), D and A (acceptors) distributed between domain and nondomain regions (black line) and iii), D and A, where both D and A are uniformly distributed in the bilayer without any domains (blue line). The red line almost coinciding with the black line is the best fit calculated by means of MC simulations. Instrument response function is displayed too. Figures in the lower part correspond to those in the upper part.