
Figure 3.
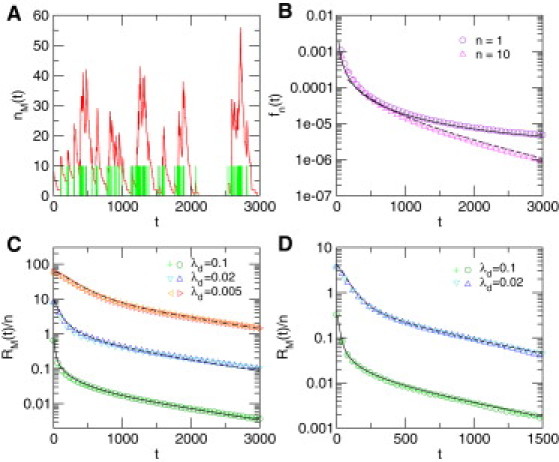
Fluctuations in mRNA levels in the case of diffusion with fractal crowding leading to compact exploration. (A) Typical evolution of the mRNA copy number, (red line), obtained by numerical simulations of the model. The nucleus is modeled as a fractal environment (here, a 3-dimensional critical percolation cluster embedded in a 123 cube) embedded in a volume , such that . Other parameter values are , n = 10, . Green bars mark the activation of the gene. (B) Waiting time distribution, , between activation events for n = 1 (violet circles) and n = 10 (magenta triangles), compared to the theoretical prediction derived in the Supporting Material (plain and dashed lines, respectively) for the same critical percolation cluster. (C) Normalized autocorrelation function for diffusion on the same 3-dimensional critical percolation cluster. Numerical simulations (symbols) for different values of and n are compared to the theoretical prediction (plain and dashed lines, respectively). (n = 1 (dark green circles) and n = 10 (light green crosses)), (n = 1 (dark blue triangles) and n = 10 (light blue inverted triangles)), (n = 1 (red triangles) and n = 10 (orange triangles)). (D) Normalized autocorrelation function for diffusion on a Sierpinski gasket (example of deterministic fractal) such that . (n = 1 (dark green circles) and n = 10 (green crosses)), (n = 1 (dark blue triangles) and n = 10 (light blue inverted triangles)).