
Figure 3.
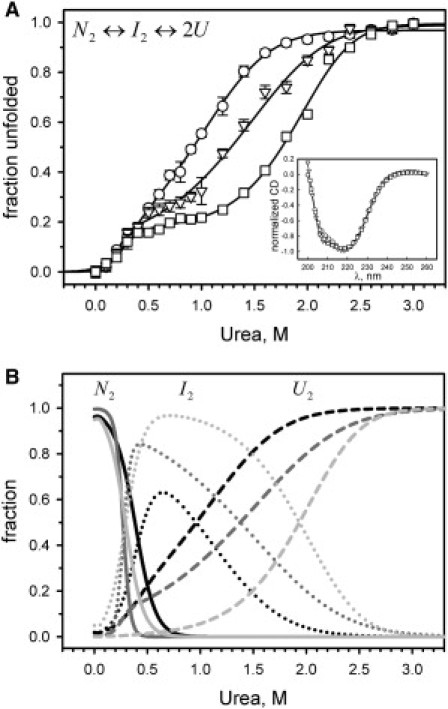
Urea-induced unfolding of FtsZ monitored by the CD at 222 nm in 50 mM potassium phosphate buffer, pH 6.5, at 25°C. (A) FtsZ unfolding at 1 μM (circles), 5.6 μM (triangles), and 46.3 μM (squares) of protein concentration. Data are displayed as an unfolded fraction, and the solid lines represent the fit to a three-state dimer unfolding with a dimer intermediate (N2↔I2↔2U). The inset in A shows the normalized ellipticity as a function of wavelength for FtsZ at 1 μM (circles), 5.6 μM (triangles), and 46.3 μM (squares). (B) Modeled fractions (from left to right) of native dimer (N2, solid lines), dimer intermediate (I2, dotted lines), and unfolded monomer (U, dashed lines) as a function of urea concentration at 1 μM (black), 5.6 μM (dark gray), and 46.3 μM (light gray), respectively. The modeled fractions were calculated using the data from the fits shown in panel A (see Table 3). The error bars in A show the SD of the CD signal at 222 nm.