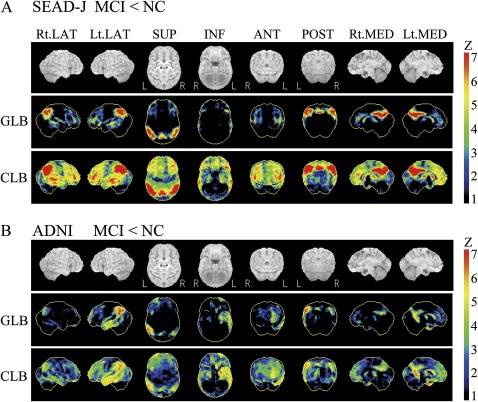
Figure 1.
3D-SSP analyses of baseline fluorodeoxyglucose–positron emission tomography in Studies on Diagnosis of Early Alzheimer's Disease—Japan (SEAD-J) (A) and Alzheimer's Disease Neuroimaging Initiative (ADNI) (B). These are the results of group comparison between MCI patients and normal controls (NC). MCI patients showed a significant decrease of the cerebral metabolic rate for glucose (CMRgl) not only in the regions preferentially affected by Alzheimer's disease (including the inferior parietal lobules and precuneus) but also in the frontal lobules. Colour bar indicates the mean Z score of CMRgl. LAT, lateral view; SUP, superior view; INF, inferior view; ANT, anterior view; POST, posterior view; MED, medial view; GLB, reference region in global brain; CLB, reference region in cerebellum.

