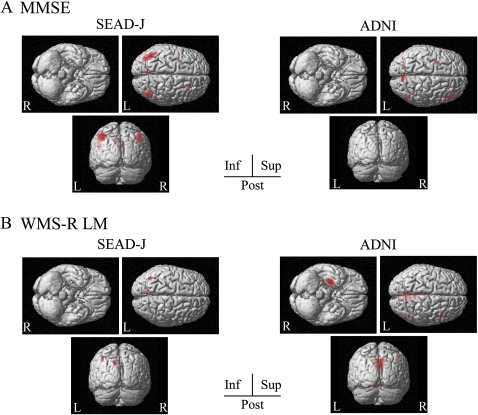
Figure 3.
Statistical parametric mapping of the brain regions correlated with baseline profiles in Studies on Diagnosis of Early Alzheimer's Disease—Japan (SEAD-J) and Alzheimer's Disease Neuroimaging Initiative (ADNI). The regions displayed in red indicate significant regional hypometabolism (p<0.05). (A) Correlation between lower Mini-Mental Status Examination (MMSE) scores and glucose metabolism. (B) Correlation between lower Logical Memory subset of the Wechsler Memory Scale Revised (WMS-R LM) scores and glucose metabolism.

