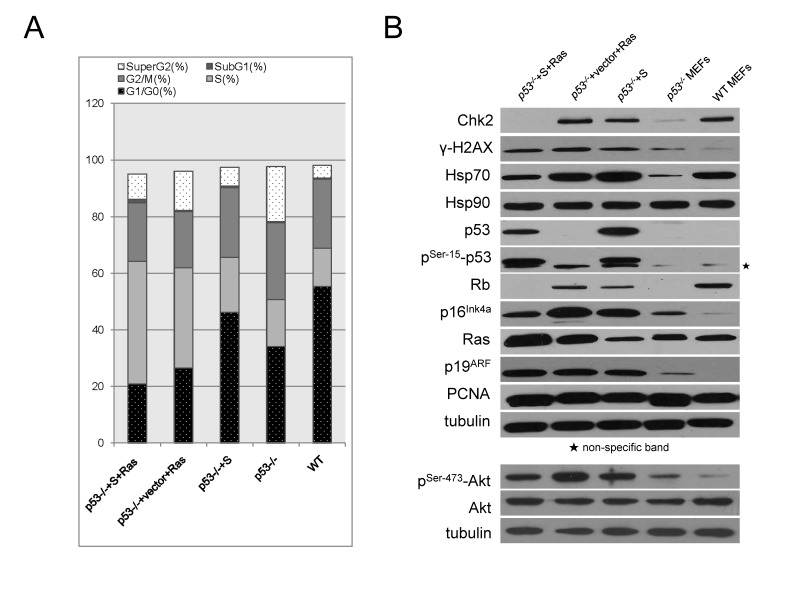
Figure 4.
The regulation of cell cycle and stress responses by p53S or/and H-RasV12. A. Cell cycle analysis by FACS revealed growth advantage from cooperation of p53S and H-RasV12. The percentage of sub G1, G1/G0, S, G2/M and super G2 were shown in sections of stacked bars. B. Western blotting analysis of protein expression profile in five cell lines: p53-/- MEFs, p53-/-+S MEFs, p53-/-+vector+Ras tumor cells, p53-/-+S+Ras tumor cells and wild type MEFs (WT). Star showed the non-specific band for phosphorylated p53 blotting.

