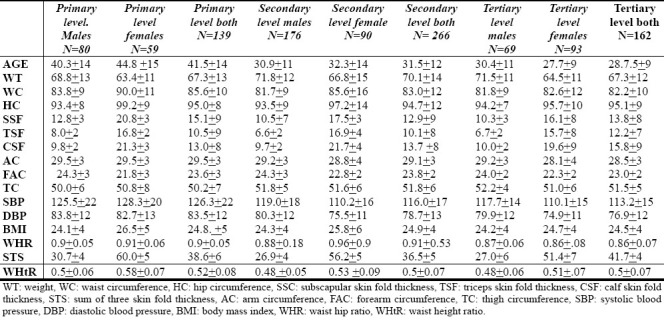
Table 1.
Summary of the means and standard deviations of the various anthropometric and blood pressure parameters by sex across the educational levels

Summary of the means and standard deviations of the various anthropometric and blood pressure parameters by sex across the educational levels
