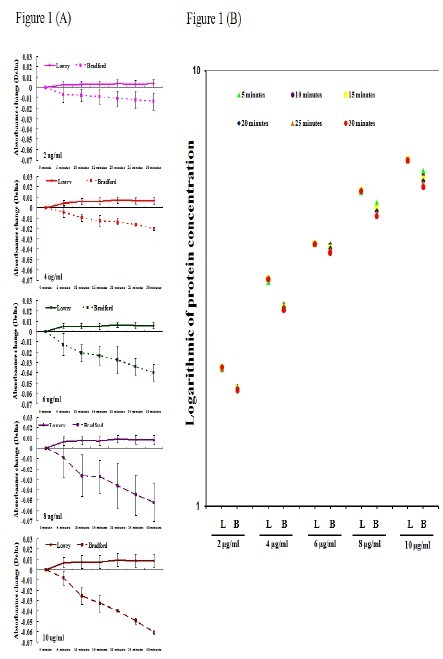
Fig. 1.

The protein concentration measurements using Lowry is more consistent than Bradford methods. The albumin, commonly used as standard for protein measurements, are prepared in serial dilutions (0μg/ml, 2μg/ml, 4μg/ml, 6μg/ml, 8μg/ml and 10μg/ml), in triplicates. The measurements were carried out using a time course of 30 minutes with 5 minutes intervals. (A) Absorbance change was calculated using the reference point of 0μg/ml at time 0, with all other samples compared to this; this value was denoted Delta. Delta is < 0.01 at every sample preparation using Lowry method; while the Delta is increasing in using Bradford method (2μg/ml: 0.007-0.013; 4μg/ml: 0.004-0.002; 6μg/ml: 0.012-0.04, 8μg/ml: 0.008-0.052; and 10μg/ml: 0.008-0.061). The X-axis in A represents 30-minutes time course on serial sample preparations; Lowry method (solid line) and Bradford method (dotted line). The Y-axis represents the Delta. (B) The Y-axis in figure 1B is protein concentration expressed in logarithmic 10. L: Lowry Method; B: Bradford Method.
