Fig. 2.

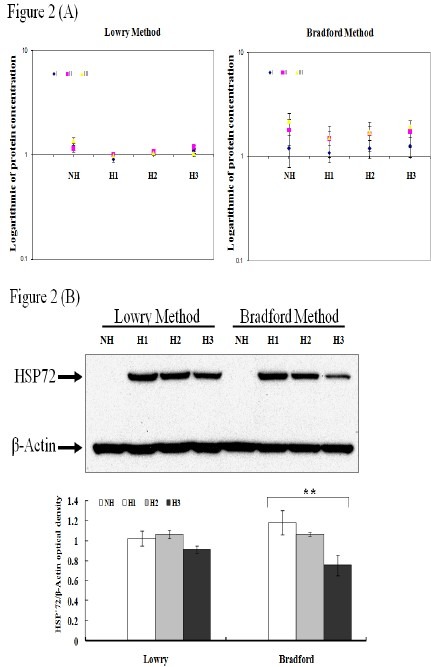
The protein concentration measurements using Lowry and Bradford resulted in protein differential expression. Total proteins are obtained from cell lysates of untreated HUVEC (NH) or 6 hours after heat shock treated HUVEC (H1-H3) from a single source from each group. (A) Protein concentrations from identical samples are measured using either Lowry or Bradford method. The measurements of protein concentration on all samples show more consistent using Lowry method while highly variable in Bradford method. The X-axis in A represents each sample; I, II, and III indicate each experiment. The Y-axis represents the protein concentration expressed in logarithmic 10. (B) The expression patterns of Heat shock protein 72 (HSP72) and β-actin from each group are examined using Western Blot. Identical samples show differential expression patterns on Western blot when concentration measurements are performed using Lowry vs. Bradford methods (triplicates) (upper panel). Protein expressions from Western blots are quantitated using Image J program (lower panel). The Y-axis represents protein expression level. The X-axis represents the method used for protein concentration measurements. ANOVA is used with P < 0.01 (**).
