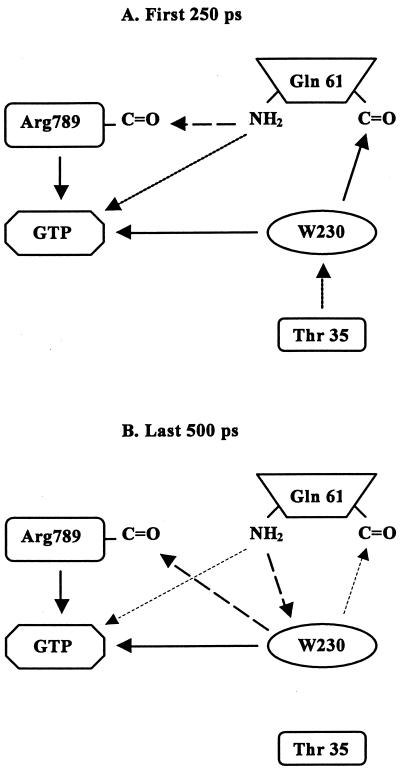
Figure 3.
Schematic diagrams of interaction patterns during the first 250 ps (A) and last 500 ps (B) of the MD simulation. Thick solid arrows represent the interactions that always exist. Interactions shown by thick broken arrows are strong and almost always exist. Interactions shown by thick dotted arrows are important, and the thin dashed arrows show weaker interactions that are infrequent.

