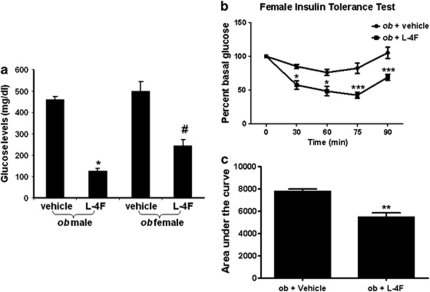
Figure 2.
(a–c) Fasting glucose and insulin tolerance test. (a) Effect of L-4F treatment on glucose levels in ob male and female mice. The results are expressed as means±s.e.m., n=4. Levels of significance: *P<0.01 vs ob male and #P<0.05 vs ob female. (b) Intraperitoneal insulin tolerance test (IPGTT). The results are expressed as means±s.e.m., n=4. Levels of significance: *P<0.01 and ***P<0.001 vs ob female control. (c) Area under the curve for IPGTT. The results are expressed as means±s.e.m., n=4. Levels of significance: **P<0.005 vs ob female control.

