Fig. 4.

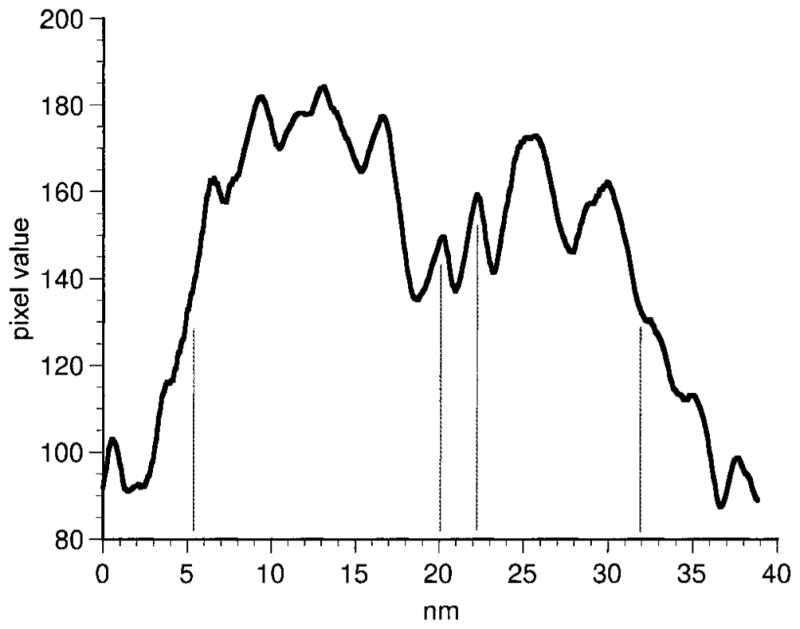
Densitometric scan of a gap junction between DB3 varicosities. The peaks indicate the densest portions of the membrane leaflets. The outer leaflets (central vertical lines) are clearly visible with a separation of approximately 2 nm.

Densitometric scan of a gap junction between DB3 varicosities. The peaks indicate the densest portions of the membrane leaflets. The outer leaflets (central vertical lines) are clearly visible with a separation of approximately 2 nm.