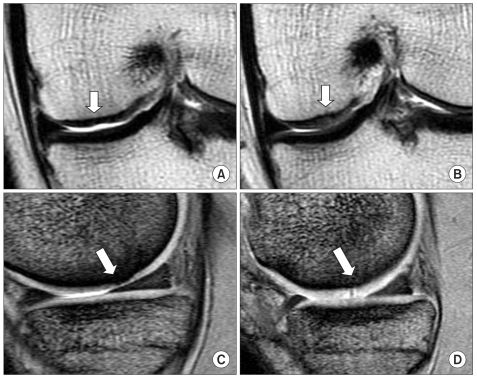
Fig. 3.
MRI findings before and after autologous chondrocyte implantation (ACI). (A) Coronal proton density image showing the focal chondral defect with thinning of the cartilage. (B) Coronal proton density image showing the slightly hyperintense repaired tissue at 26 months after ACI. (C) Sagittal T2 fast spin echo (FSE) image showing the thinning of the cartilage and irregular elevation of the subchondral bone plate. (D) Sagittal T2 FSE image showing the hypertrophied regenerated cartilage tissue with focal hyperintense area at 26 months after ACI.

