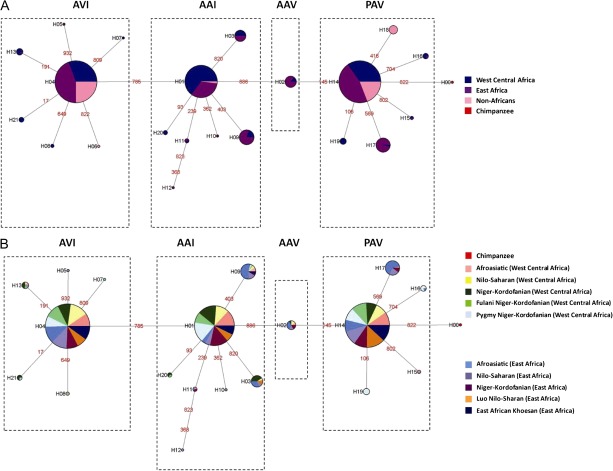
FIG. 2.
Networks of inferred haplotype relationships based on global and African data. Genealogical relationships of haplotypes were constructed using a maximum parsimony approach for (A) global populations and (B) West Central Africa and East Africa. Circles represent amino acid haplotypes, and the size of the circles is proportional to the number of chromosomes with a given haplotype. Colors within each haplotype represent the proportion of individuals within a population or geographic region with that given haplotype. The lines and numbers are the mutational changes between haplotypes.

