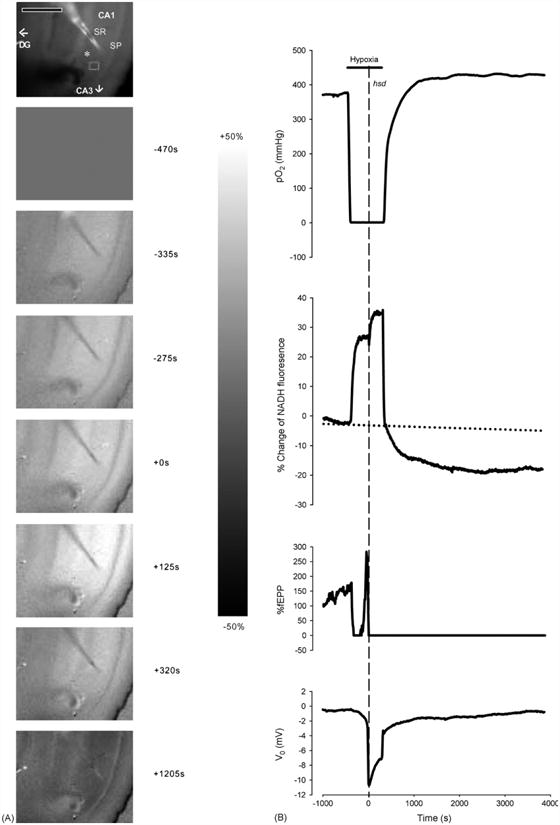
Fig. 3.

(A) Series of NADH fluorescence images during the progression of irreversible hypoxia (hsd + 5 min) in a hippocampal slice from a 25 months rat. The top image shows an unsubtracted raw camera picture with the region of interest indicated by a gray rectangle in the SR of the CA1 region. The asterisk indicates the position of the recording electrode. The oxygen and stimulating electrodes are above and below the recording electrode, respectively. Scale bar indicates 500 μm. Image times are shown in the right margin. Hypoxia was initiated at −450 s. Zero time marks the onset of hsd. The scale bar in the right margin indicates the scale for the difference images, with white representing a 50% increase above baseline and black, a 50% decrease. Note that the CA1 region is preferentially affected by hypoxia, with a marked increase in NADH signal. (B) Responses of PO2, NADH (% change), fEPSP (% change from baseline) and dc voltage to hypoxia (hsd + 5 min) in a 25 months rat hippocampal slice. The horizontal line indicates the hypoxic interval, while the dotted vertical line shows the onset of hsd. The PO2 was measured at the nadir of the slice. A regression line (dotted line) was created from the baseline data to account for the drift in NADH over time.
