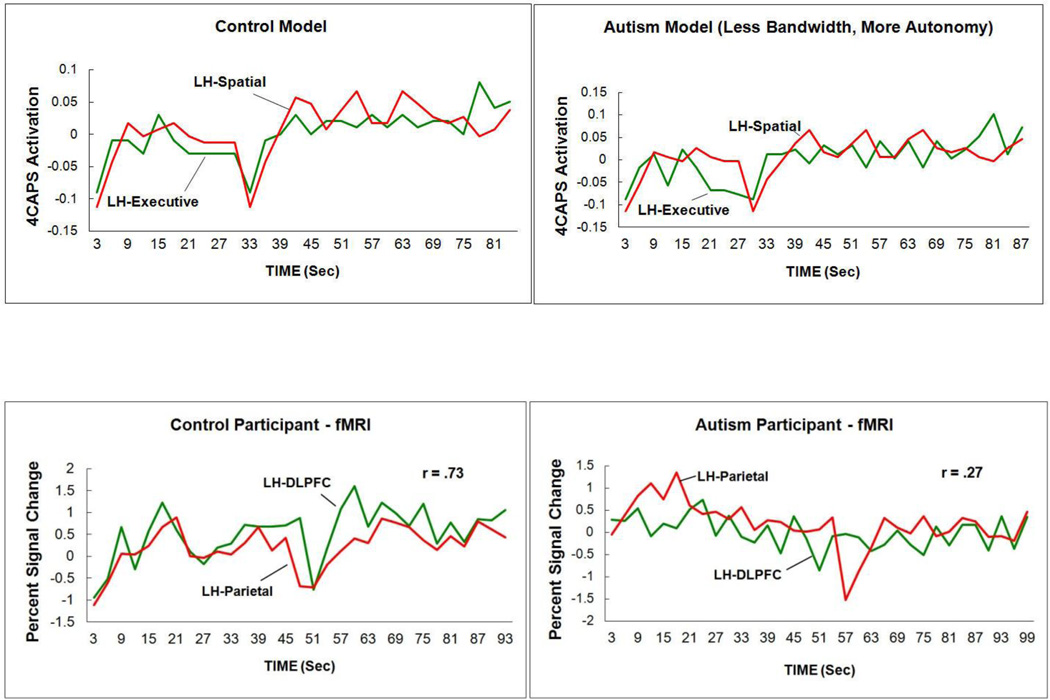
Figure 5.
Upper panel: Lower frontal-parietal functional connectivity (time series correlation) in the autism model (right-hand panel) in the Tower of London task than in the control model (left-hand panel). Lower panel: Higher frontal-parietal functional connectivity between the two activation time series in a control participant in the Tower of London task than in an autism participant (from Just et al., 2007) (same as Figure 3).

