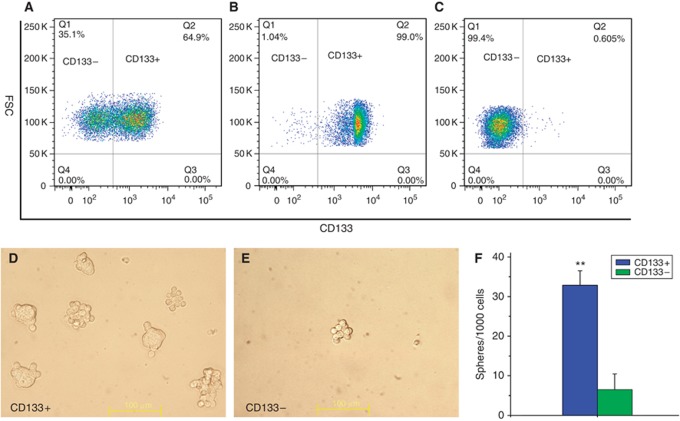
Figure 1.
Enrichment of CD133+ CSCs and CD133− NSCCs through FACS. (A–C) typical image of FACS sorting and efficiency. (A) Sorting of CD133+ and CD133− cell subpopulation. (B) Typical enrichment efficiency of CD133+ subpopulation from A. (C) Typical enrichment efficiency of CD133− subpopulation from A. (D–F) Sphere formation of CD133+ and CD133− cells. (D) Typical image of sphere formations of CD133+ cells. (E) Typical image of sphere formations of CD133− cells, bar=100 μm. (F) Statistics in (D and E) at day 4 post inoculation (mean±s.d., n=3; **P=0.00109).

