Figure 2.
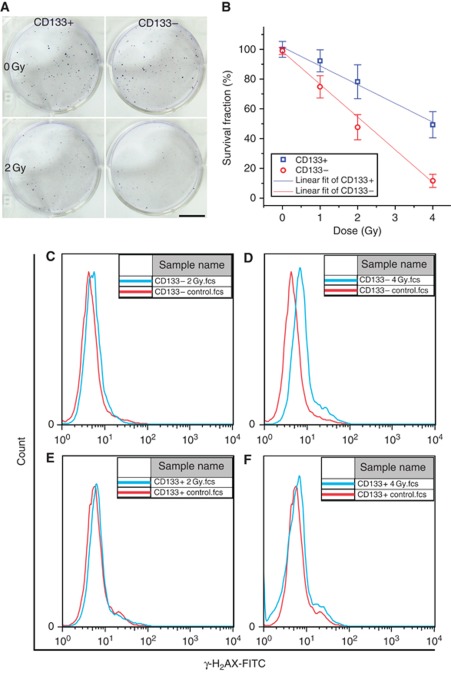
Radioresistance of CSCs. (A and B) Colony formation of CD133+ CSCs and NSCCs with or without irradiation. (A) Representative colony formation images of CD133+ CSC and CD133− NSCC controls (upper panels) and cultures irradiated with a 2-Gy dose of γ-rays (lower panels), bar=10 mm. (B) Survival fractions of CD133+ CSCs and CD133− NSCCs as a function of radiation dose. Each data point represents mean±s.d., n⩾3. (C–F) γ-H2AX assay of CD133+ CSCs and CD133− NSCCs with or without irradiation. (C) Representative immunofluorescence image of γ-H2AX analysed by flow cytometry of CD133− NSCCs with or without a 2-Gy dose of γ-rays. (D) Similar analyses of CD133− NSCCs with or without a 4-Gy dose of γ-rays. (E) Analyses of CD133+ CSCs irradiated with 2 Gy and of controls. (F) Analyses of CD133+ CSCs irradiated at 4 Gy and of controls.

