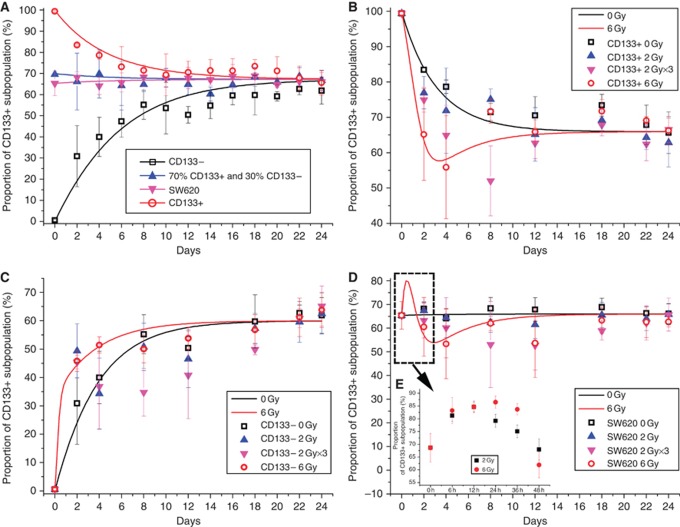
Figure 4.
Intrinsic homoeostasis between CD133+ CSCs and CD133− NSCCs. (A) Dynamic proportion of CSC subpopulation of purified CSCs, NSCCs, mixture of the two cell types, and unsorted SW620 controls over a period of 24 days. (B) Dynamic proportion of CSC subpopulation in purified CD133+ cells with or without irradiation. (C) Dynamic proportion of CSC subpopulation in purified CD133− NSCCs with or without irradiation. (D) Dynamic proportion of CSC subpopulation in unsorted SW620 cells with or without irradiation. (E) Details of data from the bracketed curve covering 0–48 h. Each data point represents mean±s.d., n⩾3.

