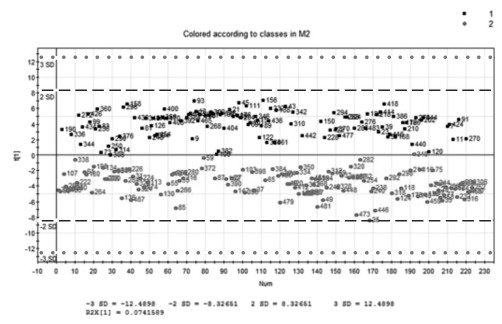
Fig. 2. Score plots of the single captured component in partial least squares regression analysis, discriminating two classes of burned patients.
Black dots: Observations belonging to class 1, later referred to as the lower risk class. Grey dots: Observations belonging to class 2, later referred to as the higher risk class. X axis: Observations. Y axis: Scores (t. of observations in single captured component of PLS-DA Black dotted lines: two standard deviations range limits Grey bullet lines: Three standard deviations range limits Black line: Class discrimination line

