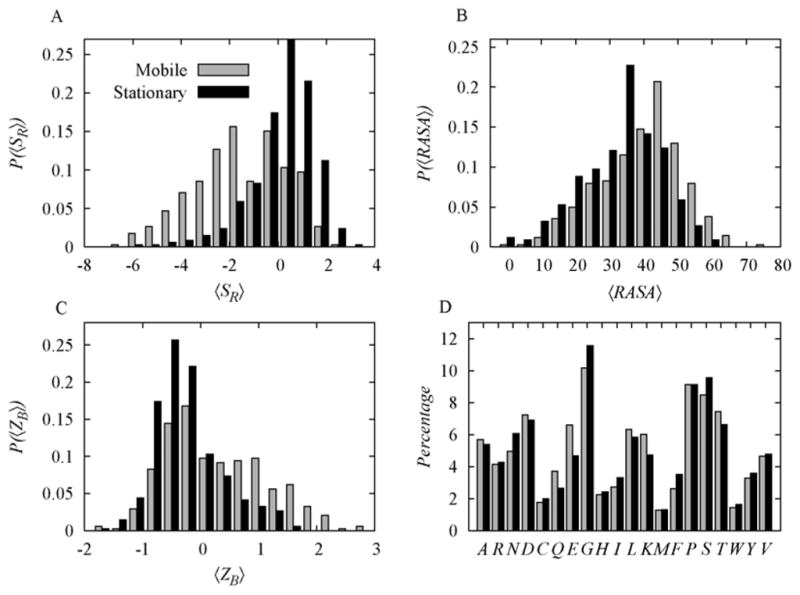
Figure 1.

A. 〈SR〉 separation between mobile and stationary loops (p-value = 2.2 × 10⁻³⁵). B. 〈RASA〉 separation between mobile and static stationary loops (p-value = 1.63 × 10⁻¹⁷). C. 〈ZB〉 separation between mobile and stationary loops (p-value = 1.6 × 10⁻⁸). D. 〈ZB〉 Residual composition comparison analysis between mobile loops and stationary loops (p-value = 0.47). All the p-values were calculated by the Wilcoxon rank-sum test.
