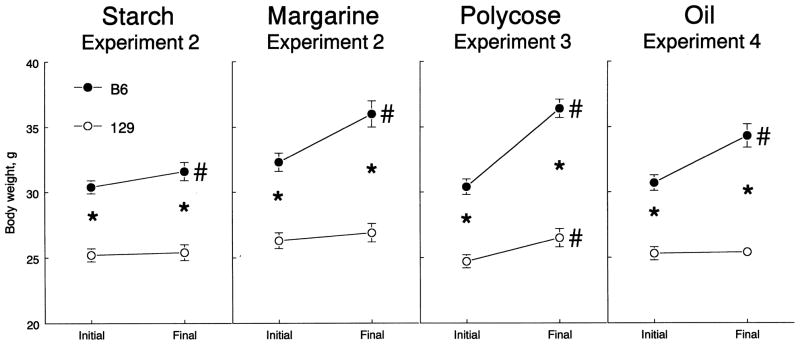
Fig. 3.
BW changes of B6 and 129 mice during access to nutrients in Experiments 2, 3, and 4. Vertical bars represent S.E.M. Initial and final BWs were measured before and after tests with a nutrient, respectively. Significant differences are indicated by * (B6 vs. 129 strains) or # (initial vs. final BW); P < .05; post hoc tests, ANOVA with no covariates (Table 2).

