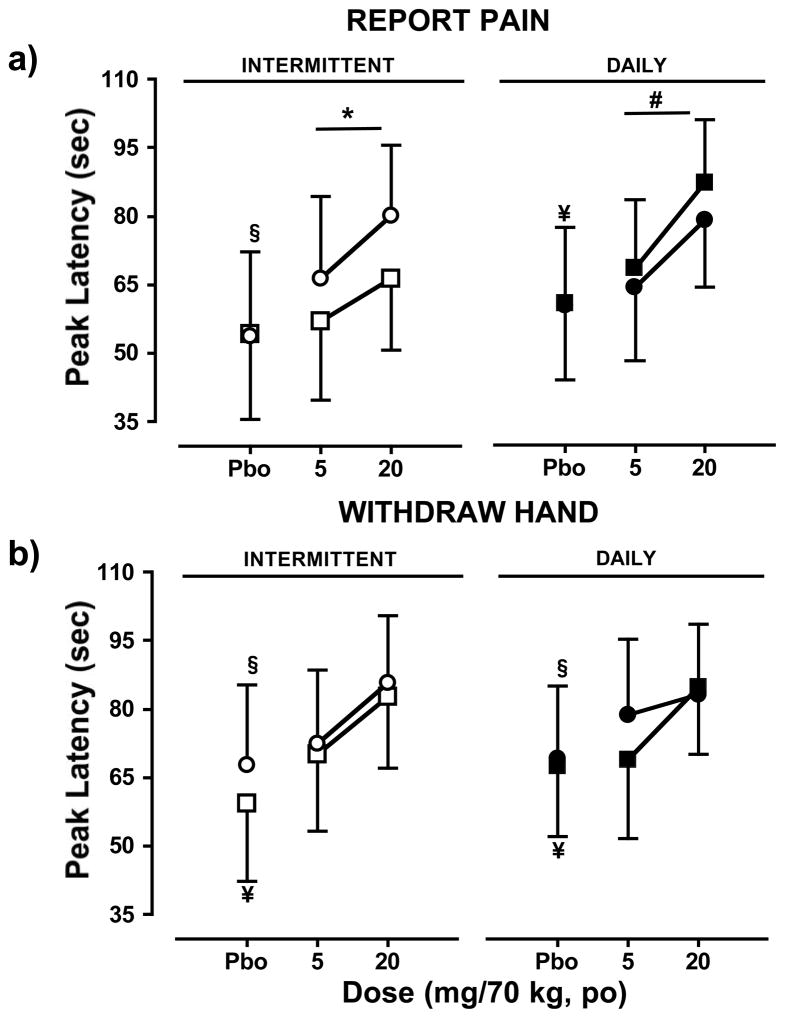
Figure 1.
Peak values (mean ± SEM) of latency to (a) report pain during the CPT and (b) withdraw the hand from the cold water (mean ± SEM ) during the first session (intermittent phase, □; daily phase, ▮) and second session (intermittent phase, ○; and daily phase, ●) as a function of cumulative oxycodone dose. Significant differences between placebo and oxycodone (cumulative doses of 5 and 20 mg/70kg) during the first session are indicated by ¥ (p ≤ 0.05), and second session by § (p≤ 0.05). Within each phase, significant differences between sessions in placebo or oxycodone effects are indicated by * (p ≤ 0.05). Between phases, significant differences between corresponding sessions for placebo or oxycodone effects are indicated by # (p ≤ 0.05).

