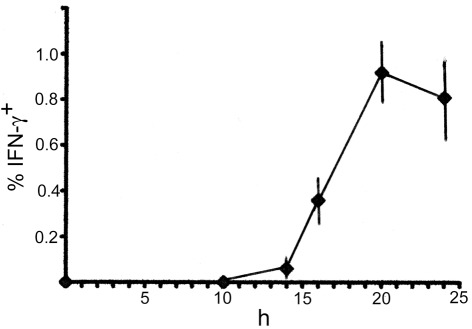
Figure 1.
Time course of IFN-γ-production in the spleen early after LM infection. C57BL/6 mice were infected with 5 × 10⁵ bacteria, and the spleens were excised at each time point indicated, examined for intracellular IFN-γ by FACS analysis. Mean percentages and SD (n = 4) of IFN-γ+ cells in total splenocytes are diagrammed.

