Figure 2.
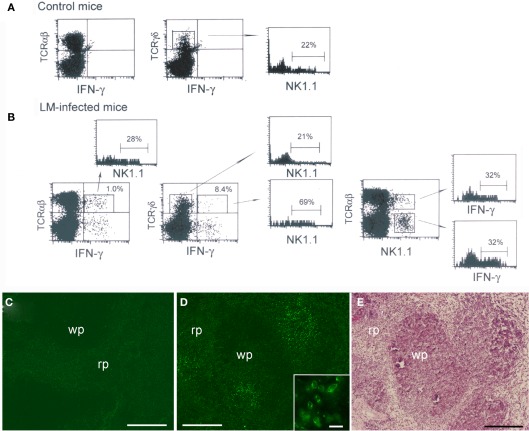
Interferon-γ production by a minor subset of αβ T cells and subsets of NK, NKT, and γδ T cells in the spleen early after LM infection. C57BL/6 mice uninfected or infected with 5 × 10⁵ LM were inoculated i.v. with BFA 4 h before sacrifice. At 20-h postinfection the spleens were excised from mice and splenocytes from uninfected (A) and infected mice (B) were stained for NK1.1, intracellular IFN-γ and either TCRαβ or TCRγδ, and analyzed on FACScan. Representative data from one of three independent experiments are shown. The numbers shown on the upper right quadrants represent mean percentages of IFN-γ+ cells in αβ T and γδ T cells, respectively, and the numbers within the histograms represent the mean percentage of NK1.1+ or IFN-γ+ cells in gated cell populations. (C,D) Immunohistochemical staining of LM-infected spleens. A formaldehyde-fixed section of the above LM-infected spleens was stained with anti-IFN-γ Ab [green (D)]. IFN-γ-producing cells form clusters. A negative control exhibits only background staining (C). Inset is an enlarged view of the IFN-γ-producing cell cluster. (E) The same section shown in (D) was subsequently stained with hematoxylin and eosin to distinguish the red pulp (rp) and the white pulp (wp). Bars in (C–E) = 200 μm. Bar in [(D) inset] = 20 μm. Representative sections are shown.

