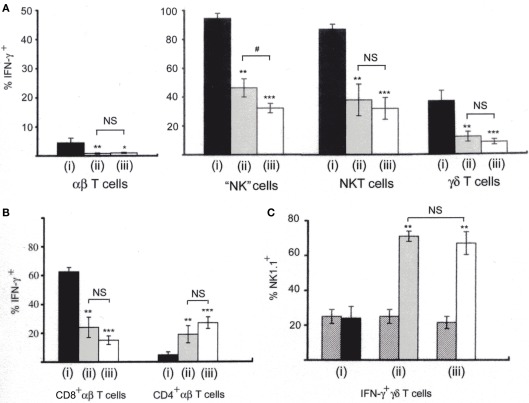
Figure 4.
Comparison of IFN-γ-producing cells among lymphocytes stimulated with three different ways. (i) NWNA spleen cells cultured with IL-12 (10 ng/ml) and IL-18 (25 ng/ml); (ii) NWNA spleen cells cocultured with dying LM-infected BMM cells; (iii) splenocytes from mice infected with LM for 20 h. Cells were stained for TCRαβ, intracellular IFN-γ and either CD4 or CD8, and analyzed by three-color flow-cytometry. (A) Percent IFN-γ- producing cells in each cell type. (B) Percent IFN-γ-producing cells in CD4+ αβ T cells and in CD8+ αβ T cells. (C) Percent NK1.1+ cells in IFN-γ-producing γδ T cells. Cells were stained for TCRγδ, NK1.1 and intracellular IFN-γ. Cross-hatched, percent NK1.1+ cells in control γδ T cells without stimulation. See also histograms of γδ T cells shown in Figure 2B. Mean percentages and SD were calculated from 3 to 5 independent experiments and statistics (Student’s t-test) compare the values of (i) to those of (ii) and (iii). *P < 0.05; **P < 0.01; ***P < 0.001. The values of (ii) and (iii) are also statistically compared. #, P < 0.05; NS, not significantly different.

