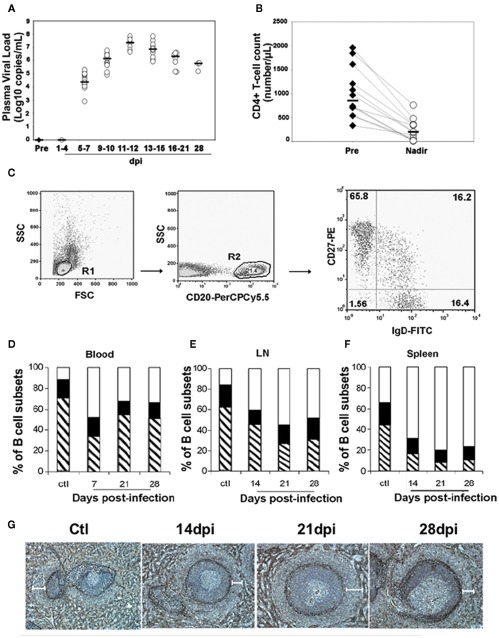
Figure 2.
Loss of MZ B-cells and switched memory B-cells during the acute phase of SIV infection. Macaques were infected intravenously with the pathogenic SIVmac251 strain. For each macaque, blood samples were taken before infection and every 3 days post-infection (dpi). Three groups of five macaques were sacrificed 14, 21, and 28 dpi. At euthanasia, spleen, peripheral blood, and mesenteric lymph nodes (LN) were collected from SIV-Infected animals and from four non-infected control animals. (A) Plasma viral load was determined by real-time PCR as described (Peruchon et al., 2009). Horizontal bars indicate median values. (B) Absolute numbers of blood CD4 T-cells were determined in each animal as described (Peruchon et al., 2009) before infection and 11–12 dpi when they reached their lowest values (nadir). Horizontal bars indicate median values. (C) CD27 and SIgD expression was studied by three-parameter immunofluorescence analysis on CD20-gated populations from various organs. Cells were gated on forward and side scatter (R1), and then on CD20 (R2) expression. CD27 and SIgD expression on CD20+ cells is shown on a representative dot plot of peripheral blood mononuclear cells staining. The percentage of positive cells is indicated in each quadrant. Flow cytometry plots depict log10 fluorescence. (D–F) Shown are the mean percentages of naïve (SIgD+CD27−, open area), switched memory (SIgD−CD27+, hatched area), and MZ (SIgD+CD27+, black area) B-cells for each group of animals (n = 3). (D) Shows data in peripheral blood before and after exposure to SIV. (E) Shows data from the spleen of non-infected animals (ctl, n = 4) and SIV-infected animals (n = 3 for all groups). (F) shows data from LN of non-infected animals (ctl, n = 4) and SIV-infected animals (n = 5 for all groups). (G) Spleen sections from non-infected macaques (Ctl) and from SIV-infected animals collected 14, 21, and 28 dpi were stained with alpha smooth muscle actin (ASM) mAb for visualization of the MZ. Shown are staining for one representative animal from each group. White bars indicate the MZ region width as measured in 19–22 ASM-stained regions in each spleen. Mean values ± SEM are 132 ± 14 μm for Ctl, and 114 ± 23, 136 ± 27, 106 ± 17 μm for macaques infected for 14, 21, and 28 dpi, respectively.

