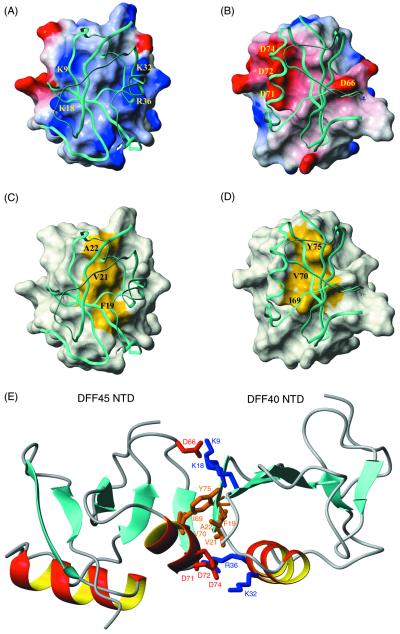
Figure 4.
Interface of the DFF40/45 CIDE complex. (A) Surface diagram of DFF40 NTD. In this figure, DFF45 NTD is shown in a ribbon diagram. The surface electrostatic potential of DFF40 is colored coded so that regions with electrostatic potential <−8 kBT are red, whereas those >+8 kBT are blue (where kB and T are Boltzmann constant and temperature, respectively). Basic residues important for the interactions are mapped on the surface. (B) Surface diagram of DFF45 NTD. In this figure, DFF40 NTD is shown in a ribbon diagram. The surface electrostatic potential of DFF45 is color coded so that regions with electrostatic potential <−8 kb are red, whereas those >+8 kb are blue (where kb and T are Boltzmann constant and temperature, respectively). Acidic residues important for the interactions are mapped on the surface. (C) Surface diagram of DFF40 NTD (same orientation as in A). In this figure, DFF45 NTD is shown in a ribbon diagram. The hydrophobic surface of DFF40 (Phe-19, Val-21, and Ala-22) is colored yellow. (D) Surface diagram of DFF45 NTD (same orientation as in B). In this figure, DFF40 NTD is shown in a ribbon diagram. The hydrophobic surface of DFF45 (Ile-69, Val-70, and Tyr-75) is colored yellow. (E) The homophilic DFF40/45 interaction involves both hydrophilic and hydrophobic interactions. Residues involved in the binding of DFF40 and DFF45 are color coded so that hydrophobic residues are colored brown, basic residues are colored blue, and acidic residues are colored red.

