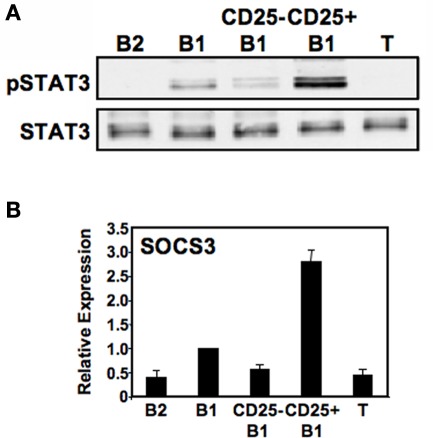
Figure 3.
CD25+ B1a cells display elevated levels of phosphorylated tyrosine705 STAT3. Five lymphocyte populations were sort-purified: splenic follicular B2 cells (“B2”), peritoneal B1a cells (“B1”), CD25− peritoneal B1a cells (“CD25− B1”), CD25+ peritoneal B1a cells (“CD25+ B1”), and splenic T cells (“T”). (A) Protein extracts were prepared from each of these populations and immunoblotted for expression of pTyr705STAT3 (“pSTAT3”). Blots were stripped and reprobed for expression of total STAT3 as a loading control. Representative results from one of two comparable experiments are shown. (B) RNA was prepared from each of these populations, reverse transcribed, and evaluated for expression of SOCS3 by real-time PCR, normalized to β2-microglobulin. Expression by each population relative to peritoneal B1a cells is shown as the mean of six experiments with lines indicating the SE of the means.

