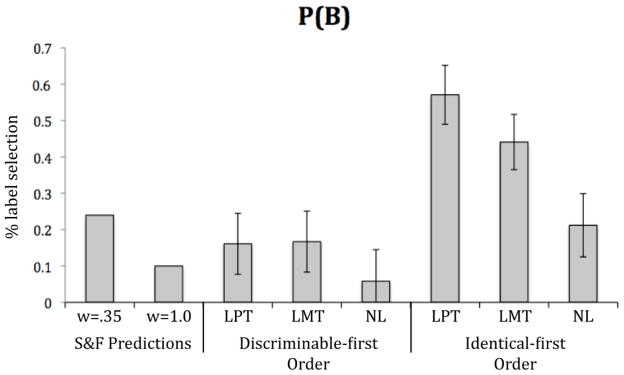
Figure 1.
P(B) (mean % label selections) for discriminable items only (SR = 9), as predicted by Sloutsky & Fisher (2004) (label effects, w=.35; no effect of label, w=1.0) and as obtained by Noles & Gelman (2012) (Discriminable-first Order and Identical-first Order). Note: LPT = Labels plus training; LMT = Labels minus training; NL = No labels.

