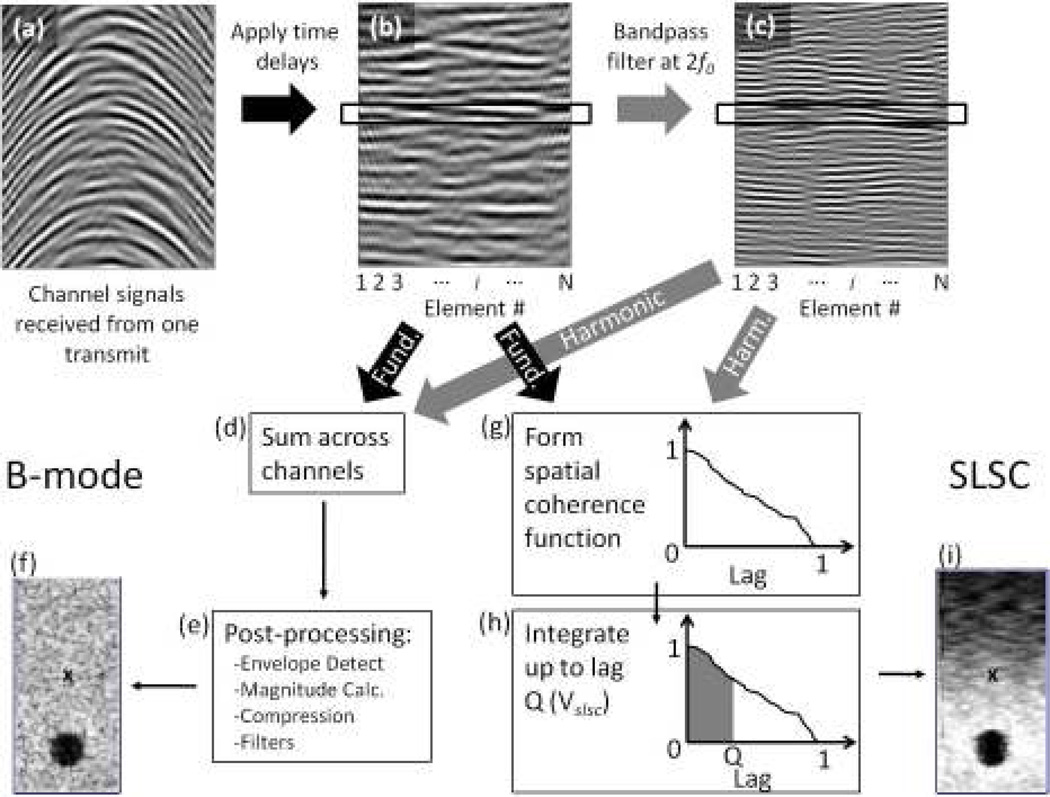
Fig. 1.
The processes of forming B-mode and SLSC images. (a) First, the echoes from a pulse are recorded by the transducer elements. (b) Time delays are applied to the echoes. The echoes can then be used to form B-mode or SLSC images, or they can be (c) bandpass filtered at the second harmonic frequency, 2f0 for harmonic B-mode or HSCI imaging. For B-mode images, the echoes in (b) or (c) are (d) summed across the elements and then (e) passed through several post processing steps to arrive at (f) the B-mode image. For SLSC (and HSCI) imaging, (g) the echoes within the black box in (b) or (c) are cross-correlated with one another to form a spatial coherence function. (h) The spatial coherence function is integrated up to lag Q to obtain the pixel value in (i) the SLSC image. Steps (g) and (h) are repeated over depth for each pulse-echo over a FOV to form an image. The pixel value labeled ’x’ in the SLSC image (i) has a corresponding pixel value in the B-mode image (e).

