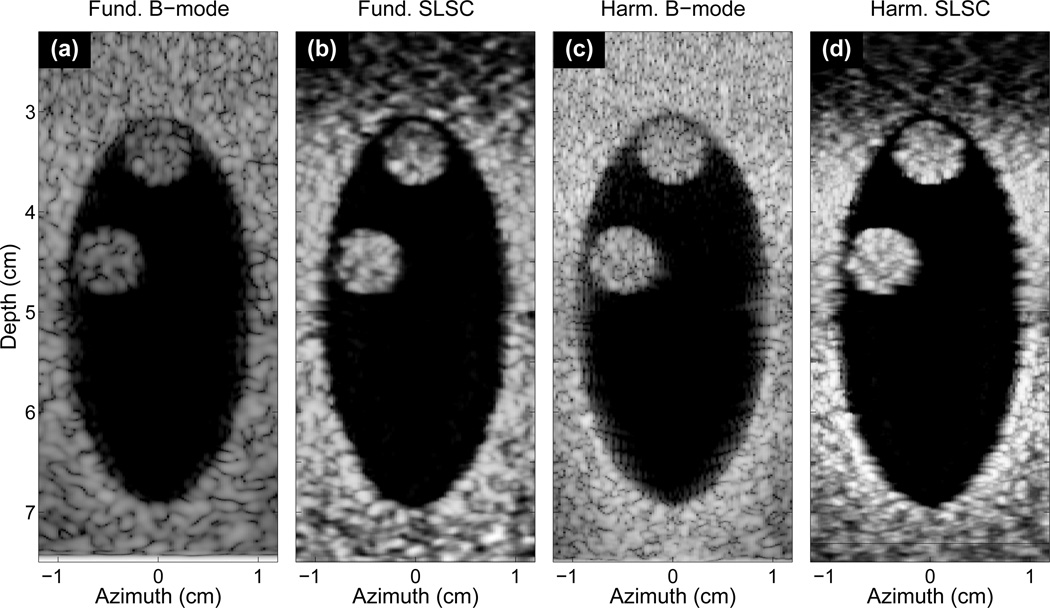
Fig. 2.
(a) B-mode, (b) SLSC, (c) harmonic B-mode, and (d) HSCI images of a simulated heart chamber with no intervening skin and subcutaneous layers and two thrombi located at 35 and 45mm depth. Both thrombi are visible in all images. The SLSC and HSCI images show smoother background and tissue layers, but also delineate the space between the thrombi and the chamber walls in better detail than the two B-mode images.

