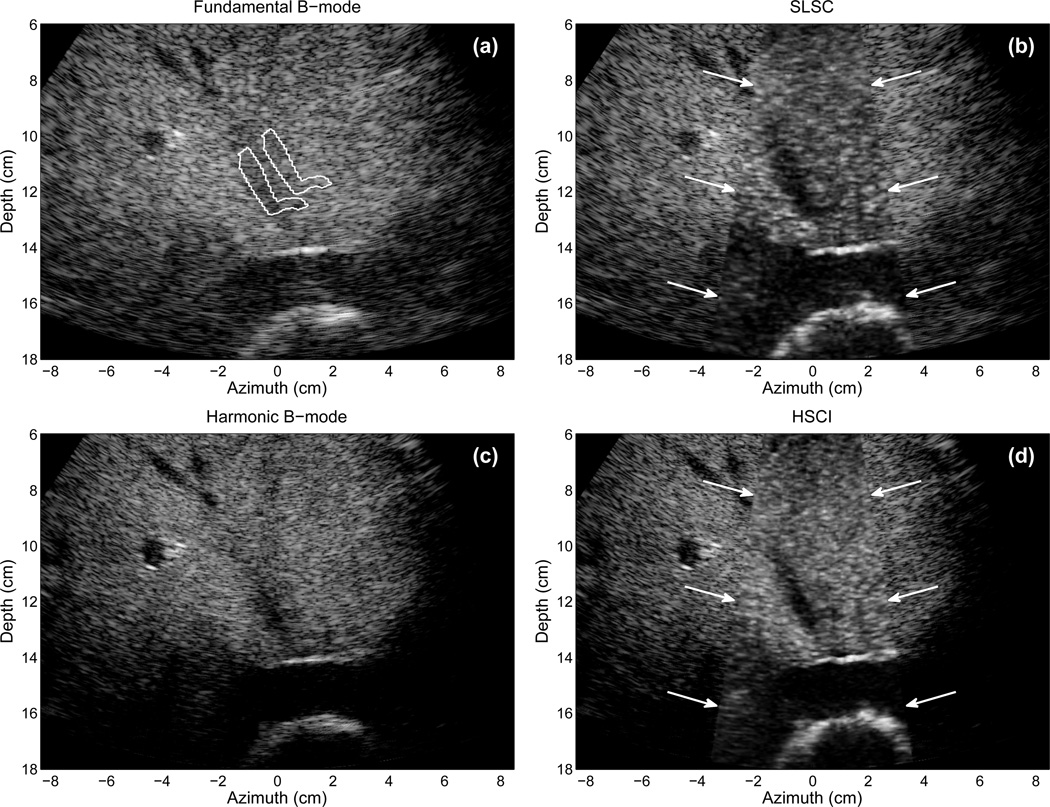
Fig. 4.
(a) Fundamental B-mode, (b) SLSC, (c) harmonic B-mode, and (d) HSCI images of the liver of a 57-year-old male. Arrows demarcate the boundaries of the SLSC and HSCI images. The vertically aligned vessel at 10–13 cm is better visualized in the SLSC and HSCI images. Delineation of a branch off of this vessel is observed in the SLSC and HSCI images which is not visible in the B-mode image. Brighter background is observed in the HSCI image compared to the SLSC image due to the improved coherence of the harmonic signal. The B-mode images show 35 dB of dynamic range while the SLSC images show approximately full linear scale. The countour lines in (a) indicate the regions used for quantitative measures.

