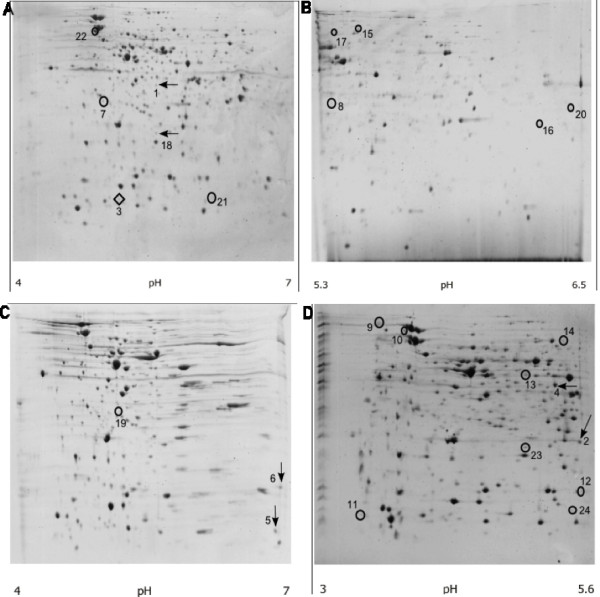
Figure 2.

2D-PAGE images of total cell protein from MC1061/Φ24B::Kan. IEF on pH range 4-7 (A, C), 5.3-6.5 (B) and 3-5.6 (D). Arrows represent proteins identified as phage encoded; circles represent proteins identified as encoded by E. coli, but not present on corresponding naïve MC1061 gels (data not shown).
