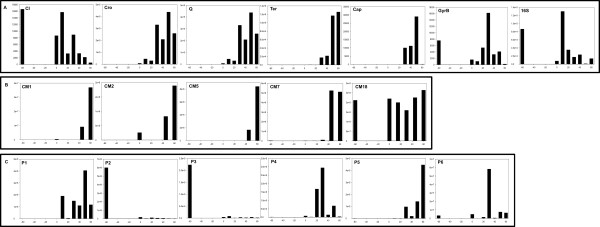
Figure 3.
Graph depicting gene expression profiles before and following norfloxacin induction. Panel A: Control Genes. CI, marker gene for lysogeny-restricted expression; Cro and Q, marker genes for early induction response; Ter and Cap, marker genes for late gene expression; GyrB and 16S, marker genes for the cellular response. Panel B: Expression profiles of the prophage genes identified by CMAT. Panel C: Expression profiles of the genes identified by 2D-PAGE analyses of the lysogen. The Y axis represents gene copy number per 300 ng of RNA; the X axis represents time (min). Time -60 refers to the samples taken before induction and represents the lysogen population, Time 0 represents samples taken at the beginning of the recovery time, Time 10, 10 min after recovery, etc. The experiment was run using biological replicates, but due to the asynchronicity of induction across these experiments the data from a representative single biological replicate are shown.

