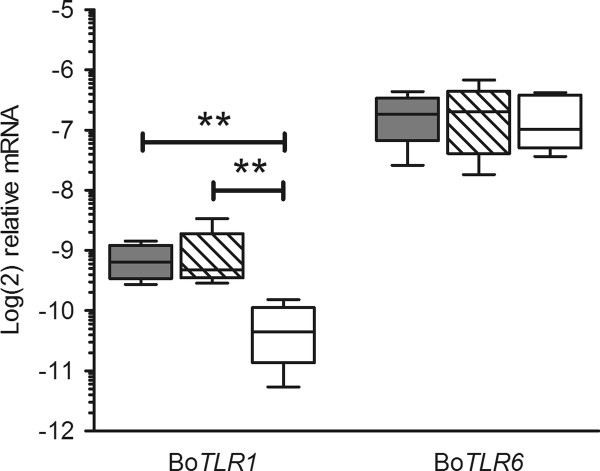
Figure 3.
Q-PCR data showing basal mRNA abundance levels of boTLR1 and boTLR6 in milk somatic cells grouped into the three boTLR1 -79 T > G SNP variant populations: TT, TG and GG. Data from each variant population (n = 5) is presented as a box and whisker plot, with the ends of the whiskers representing the minimum and maximum data values. Grey box plot - TT animals, hatched box plot - TG animals, and open box plot - GG animals. ** Genotypic means differ significantly (P < 0.01 by ANOVA and Tukey's multiple comparisons).

