
Figure 7.
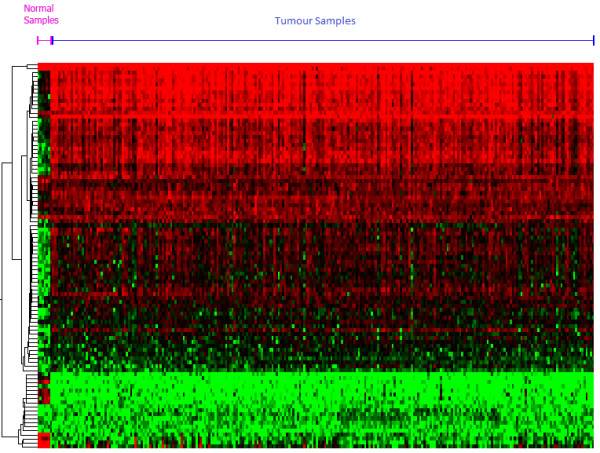
Heat map of 53 differentially expressed genes in tumours. Heat map of 53 genes isolated using SNR across 43 iterations. Hierarchical clustering was used to generate the heat map, revealing oncogenic behaviour in the top subcluster and tumour-suppressor activity within the bottom subcluster.