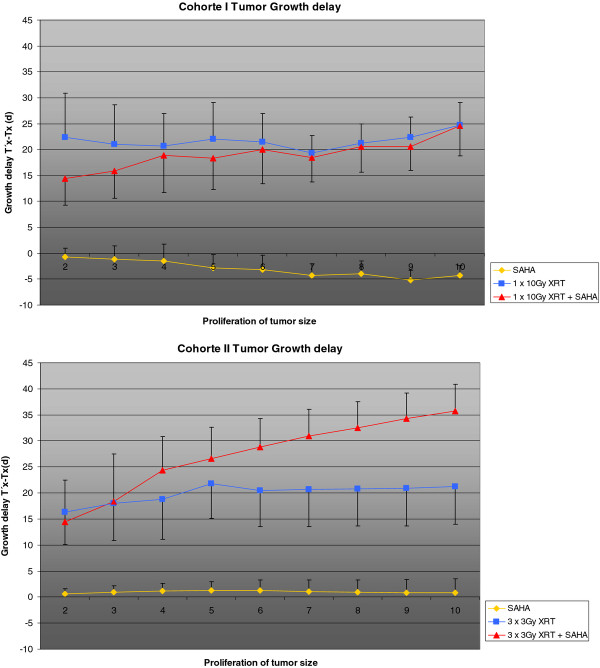
Figure 5.
Actual tumor growth delay was calculated with (T'x-Tx)/Tx as the time taken for the irradiatied tumors (T') and the control tumors (T) to x-fold multiply their volume (x). The y-Axis shows tumor growth delay in days, the x-axis shows the tumor growth (T'x-Tx)/Tx. Tumor growth delay was significant in Cohort II (p < 0.05), but not in our initial Cohort I.

