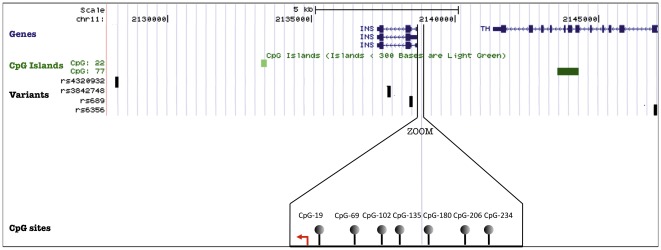
Figure 4. UCSC Genome Browser map of the INS locus : localization of genes, CpG islands (CGI), variants and CpG sites.
Genes are represented by blue boxes (exons) and lines (intron). Under genes, CGI are in green. Green intensity and size of the box is function of the size and the number of CpG included in CGI. Polymorphisms are represented by black boxes, under CGI. Below, a zoom of the INS promoter allowing the localization and representation of the isolated CpG sites, according to the TSS, represented by the red arrow.

