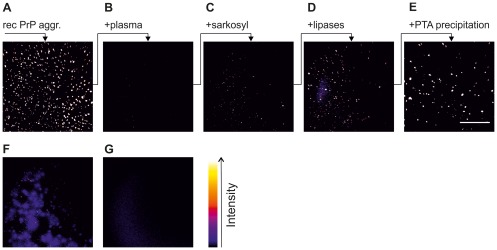
Figure 2. Detection of recPrP particles in the presence of blood plasma.
To better resolve grayscales, images are colorized with ‘fire’ lookup table (cf. right bar). Each sample contained 50 ng recPrP aggregates in 100 µl sample volume. All samples were analyzed by surface-FIDA assay using SAF-32 as capture and detection antibody. One image corresponds to 1% of the total well bottom area. RecPrP aggregates (A) in PBS, (B) in ovine plasma, (C) in plasma and 2% sarkosyl, (D) in plasma after sarkosyl and lipase treatment, (E) in plasma after sarkosyl and lipase treatment and PTA-precipitation, (F) in plasma after PTA precipitation. (G) negative control: non-spiked plasma after sarkosyl, lipase and PTA steps.

