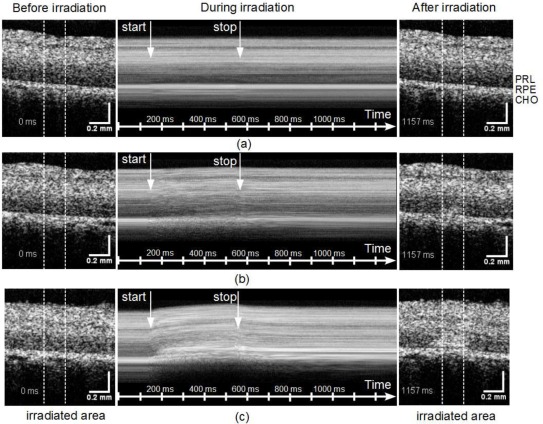
Figure 5.
OCT images before (left) and after (right) the irradiation for three representative lesions 89 W/cm2 [ Media 1 (3.8MB, MPG) ] (a), 220 W/cm2 [ Media 2 (3.8MB, MPG) ] (b), and 400 W/cm2 [ Media 3 (3.8MB, MPG) ] (c). The region of the laser exposure is marked by two vertical lines. The dynamics of the tissue changes are visualized in the corresponding movies, which show the whole time sequence of B-scans. By laterally averaging A-scans in the irradiated region (within the white lines) an M-scan (averaged A-scan versus time) was calculated (center). Starting and end point of the irradiation are marked by arrows. Retinal layers are marked by PRL: photoreceptor layer, RPE: retinal pigment epithelium, CHO: choroid.

