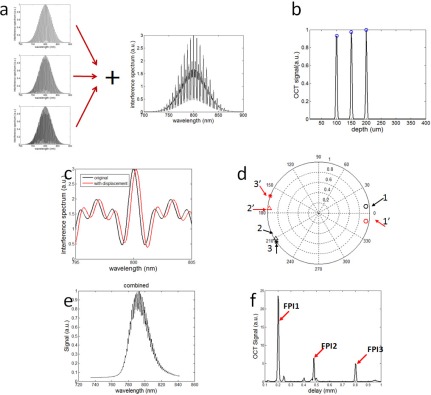
Fig. 2.
(a) Superposition of spectral interference signals from three FP cavities; (b) OCT signal with three coherence peaks corresponding to three FP cavities; (c) central part of the interference spectrum: with (red) and without (black) additional displacement δli; (d) complex OCT signals at the 1st, 2nd, and 3rd coherence peaks in the complex plane using polar coordinate system. Black symbols and red symbols represent OCT signals with and without additional displacement δli; (e) actual interferometric spectrum obtained from the FPI-FS; (f) amplitude of OCT signal obtained by Fourier transforming spectrum shown in Fig. 2(e).

