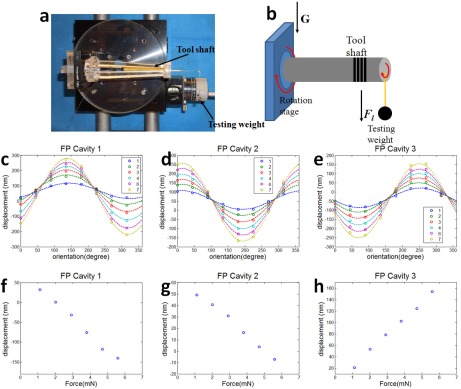
Fig. 5.
(a) Photo of lateral calibration setup; (b) schematic of lateral calibration setup; (c)–(h) results from lateral calibration: (c)–(e) show displacements measured from three FP cavities at different θ with different lateral forces. Legends indicate number of testing weights applied to the sensor; (f)–(h) show displacements with different lateral loads when θ was 3π/2.

