Fig. 2.
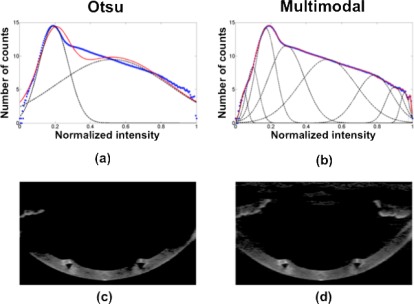
(a) Semi-logarithmic representation of the 3-D image histogram using normalized intensity (blue points) and fitted data provided by the statistics of the Otsu’s statistical thresholding method (red points). (b) Result of the multi-modal fitting in red (9 different number of classes were found). In (a) and (b) classes are represented by dash black lines (c) Result of the application of the Otsu’s algorithm on a cross sectional image. (d) Result of the application of the multimodal algorithm on the same cross sectional image.

