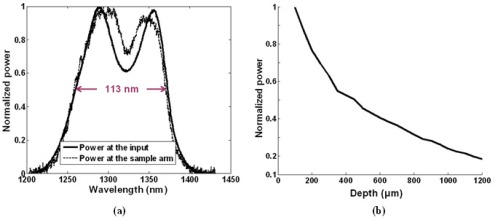
Fig. 2.
(a) Comparison of the light source spectrum at the input to the OCT system (solid line) and at the output of the sample arm (dashed line). The very similar shape and bandwidth signifies that the optics in the OCT system have not caused a spectral distortion (narrowing) and thus a potential reduction of the axial resolution of the system. (b) Decrease in system SNR (proportional to power at the sample arm) as a function of depth, implying a ~13 dB reduction in SNR when going from a depth of ~200 μm to ~1200 μm. The graph is a continuous representation of 22 point measurements.

